GMoor is your ideal tool for linear systems, where the frequency domain (FD) analysis will give you almost instantaneous results and a whole batch of analyses can be completed in seconds. But sometimes you are faced with complex spreads that may not be suited for frequency domain. To deal with systems that includes non-linearities GMoor has a Low Frequency Time Domain (LFTD) feature, that will get you around some of the issues that non-linear spreads may exhibit.
We will be showing how to set up GMoor to run LFTD and the time domain tools in GMoor.
The mooring spread we will be using to demonstrate the strength of GMoor LFTD is a 16-line system, made up of different mooring component, and several sub-surface buoys; in a water depth of 217m. The figure below shows the catenary of Line 1, which is made up of chain, polyester, wire and 2 sub-surface buoys. Below is also a figure of the whole spread.
 Catenary Mooring Line 1

Mooring Spread
This spread is designed for a Tropical Revolving Storm; hence we are expecting large environmental loads, you can see a summary of the environment in the table below. The storm direction is such that it is coming down the southern cluster (Lines 13-16)..
|
Wave, Hs [m] |
11.1 |
|
Wave, Tp [s] |
12.9 |
|
Current [m/s] |
1.96 |
|
Wind [m/s] |
36.1 |
If we first run this system in frequency domain, and then turn on the LFTD you will see that the offset and tension may show quite some difference. This would indicate that the system we are dealing with is non-linear.
To switch on the LFTD you need to go under “Analysis Settings” and tick “Low Frequency Time Domain”, you can also change the seed number here.

Turn on LFTD
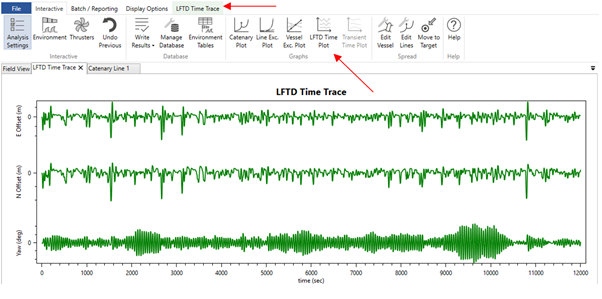
That’s it! However, since we are now running time domain you may need to run several different seeds. You can do this either through the batch scripting facility (We recommend this) or you can do it through the “manual batch” feature. To visualize the time trace on screen you can click on the “LFTD Time Plot” you can also save this to a figure or the values to a CSV file.

LFTD Time Trace
On our development list is a dedicated post-processing tool for LFTD analyses, however for now you will have to paste the line tensions from each of the seeds into a spread sheet. Where you can do the post-processing to DNVGL-OS-E301 or another code of your preference. The results we will show you are done to DNVGL-OS-E301 which assumes your peak loads to be Gumbel extreme value distributed:

To validate GMoor we have set up an identical mooring spread in an alternative time domain software. The alternative TD software is “full” time domain solver, so the wave frequency motion is also in time domain.
We have summarized the 3 results (Frequency Domain, LFTD and Alternative TD software) below with a focus on the mooring line peak tensions.
You can see how close the peak tensions of GMoor LFTD is to the Alternative TD Software, but you get them at a fraction of the time.

Intact Mooring Tensions
If you are dealing with non-linear mooring spreads, GMoor Low Frequency Time Domain can give you good analysis results without having to re-create your model in an alternative “full” time domain software. With the scripting capability of GMoor10 you can setup post and pre-processing tools to efficiently tackle large batches of analyses.
Global Maritime is continuously developing GMoor to meet the demands of the industry and the request of our clients. We currently testing a beta version with the new requirements for thruster assisted moorings: ATA. But we are also looking at improving the LFTD pre- and post-processing tools including on screen plotting, and much more… Your suggestions or improvements are always welcome.
Note: GMoor10 with ATA and improved LFTD tools has now been released.
For further information or queries you can contact us on: support@globalmaritime.com